About Me

✓
Vikas Chaurasia
AI/ML Engineer · GenAI Application Developer
I design, build, and deploy GenAI systems that turn domain knowledge into reliable, production-ready decision support.
With an MSc in Data Science & Business Analytics, I combine SQL, Python, ETL workflows, and business-facing analytics to design reliable data products, and ship GenAI + ML systems that deliver measurable outcomes.
🧠
Design
AI Architecture
Phase 1
🔧
Build
End-to-End Systems
Phase 2
🚀
Deploy
Production APIs
Phase 3
// What I Deliver
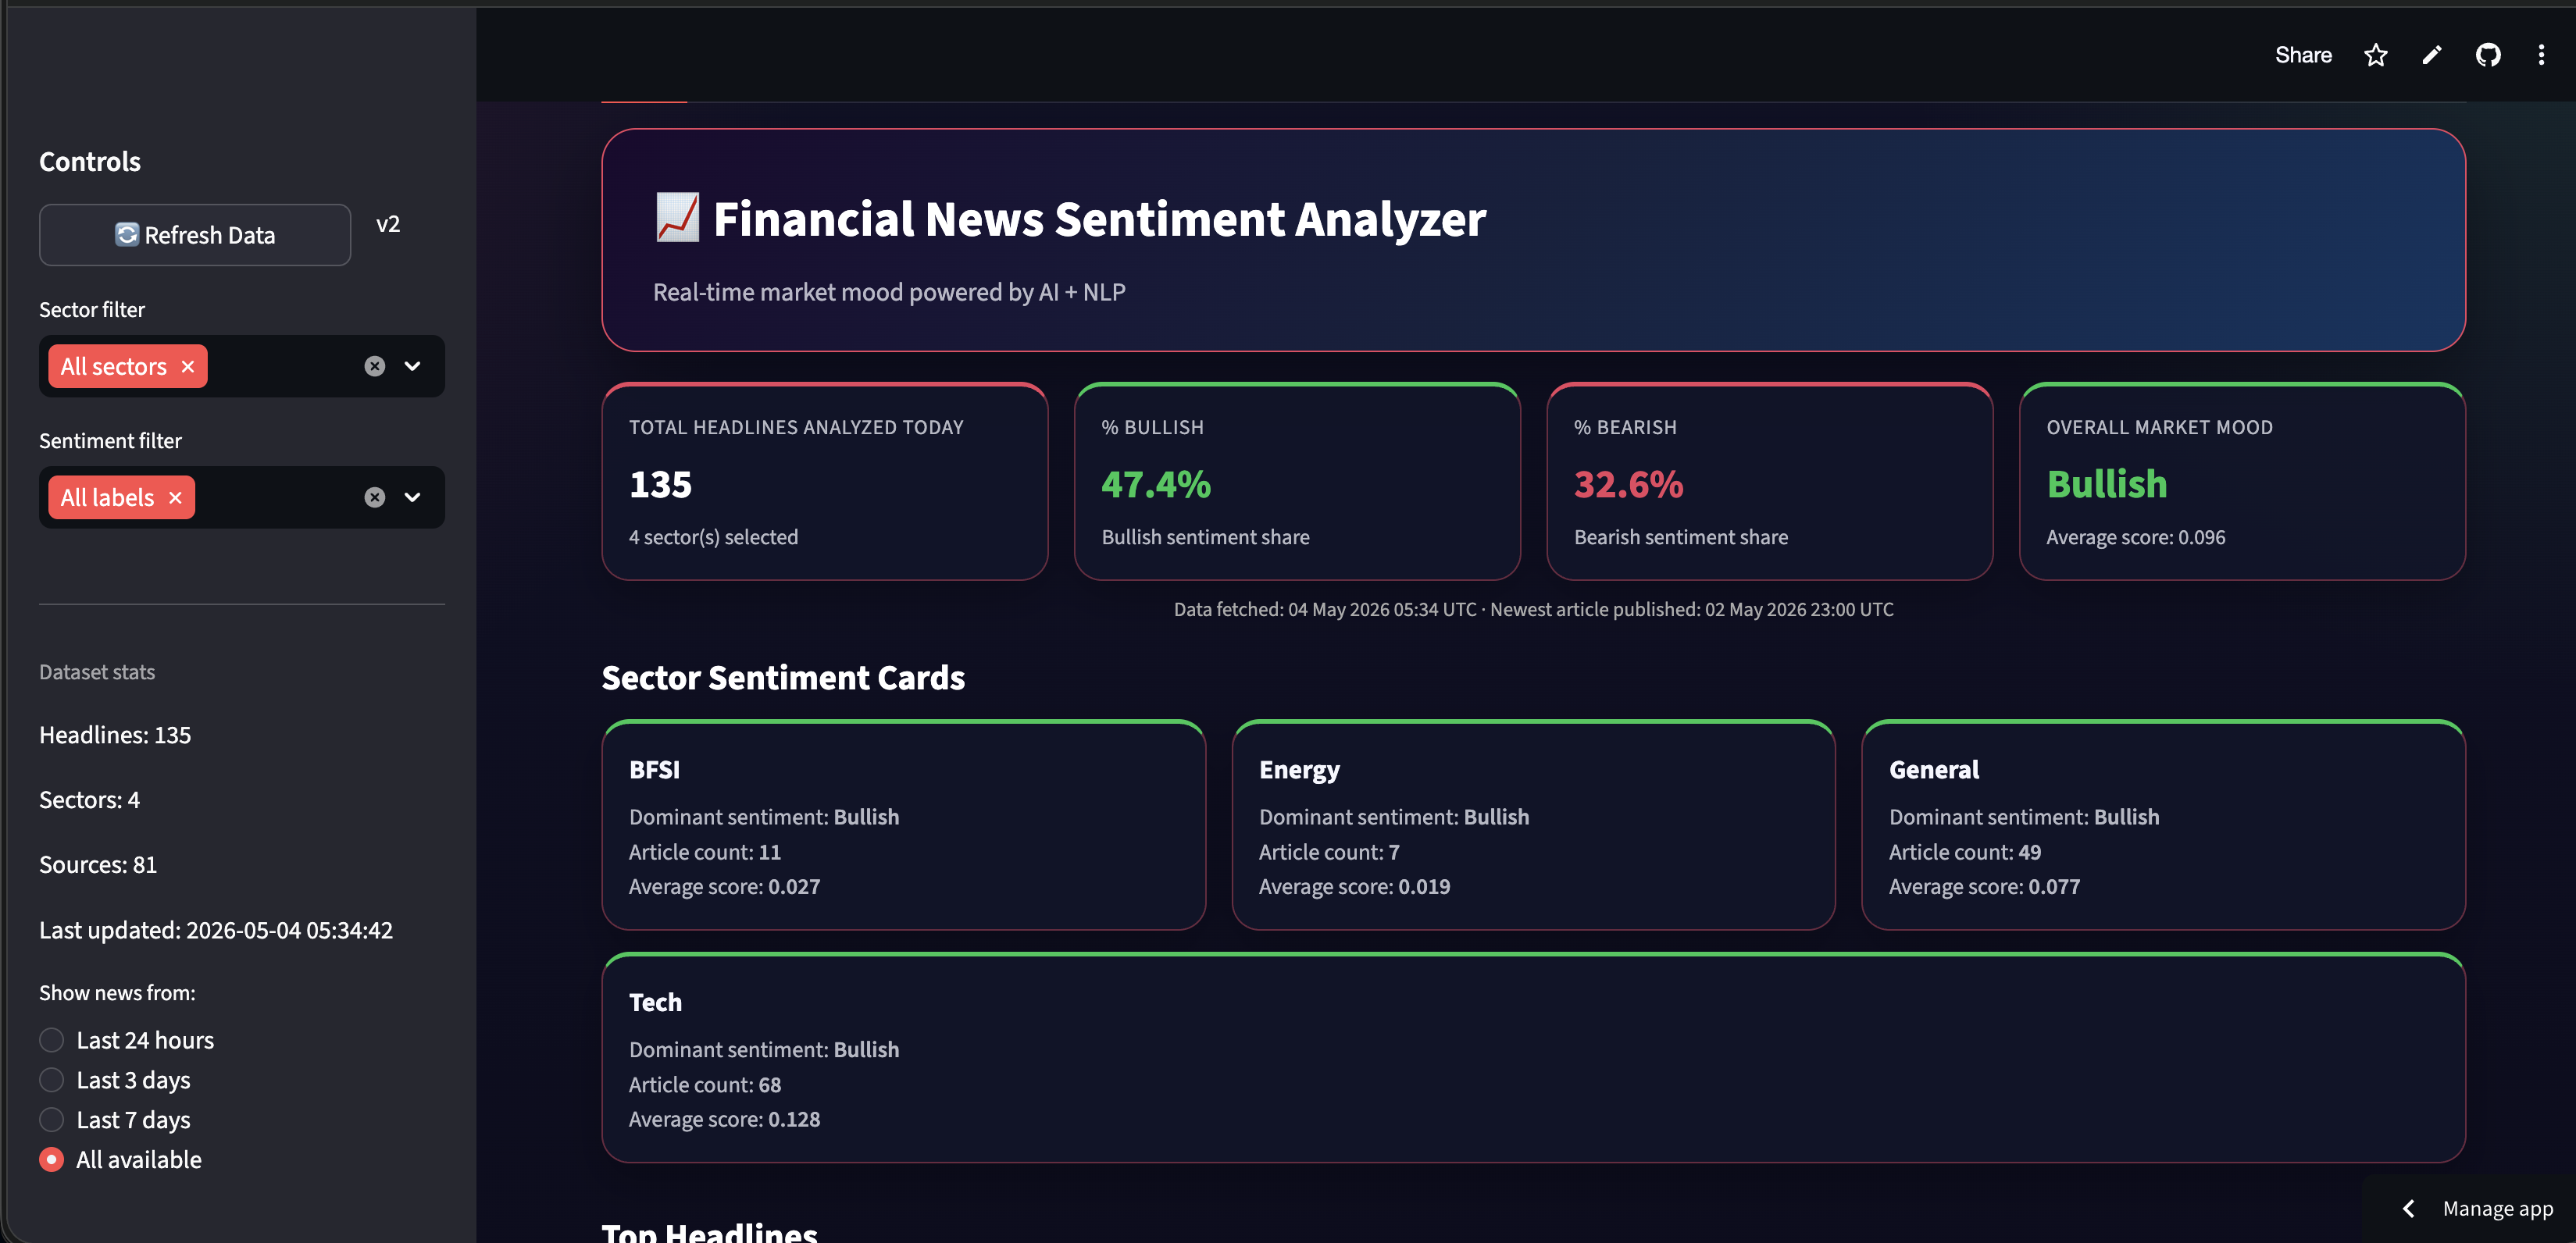
- ▶ RAG pipelines that retrieve and reason over domain-specific documents
- ▶ Multi-agent systems with LangGraph for complex, multi-step business workflows
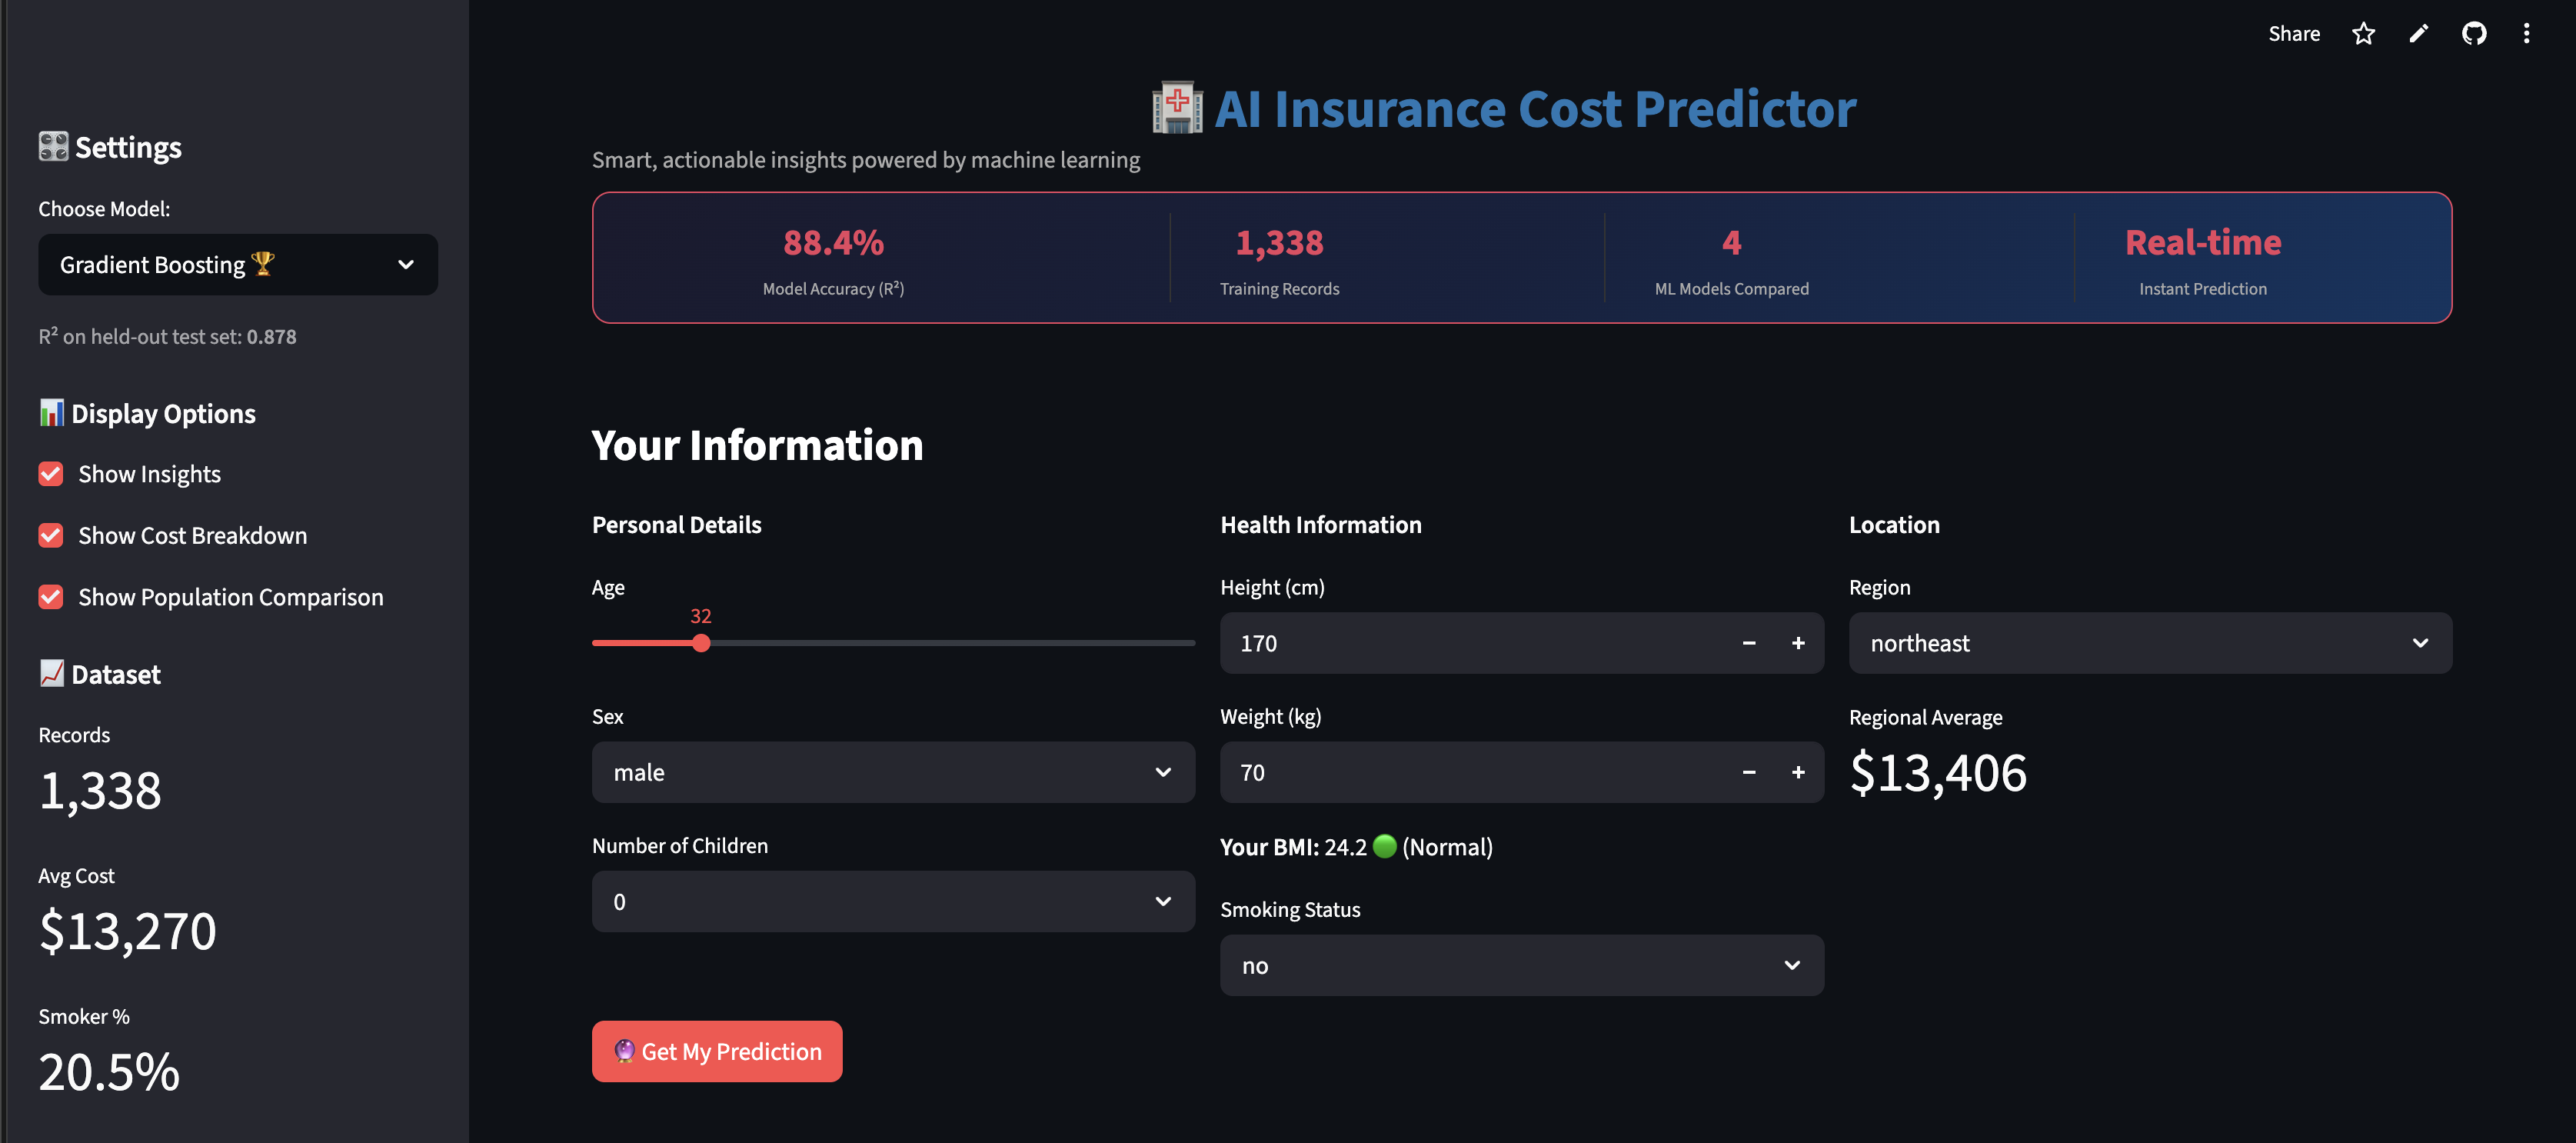
- ▶ Production ML APIs (FastAPI + Docker) with experiment tracking via MLflow
- ▶ GenAI applications that non-technical stakeholders can actually use
// My Approach
- 🧠 Start from the business problem — then pick the right model/architecture
- ⚡ Build for production from day one — not just a working notebook
- 📊 Evaluate rigorously — calibration, drift monitoring, benchmark metrics
- 🚀 Ship it — live deployments, not just GitHub repos
Looking for an AI/ML Engineer who ships production systems?
AI & ML Engineering Stack
// GenAI & Orchestration
LangChain
LangGraph
Hugging Face
Groq / Ollama
LLMs (Llama 3, GPT-4)
// Machine Learning & APIs
Scikit-learn

FastAPI

Docker

NumPy / Pandas

// Data & Query Stack
Python

SQL / Postgres

Vector DBs (Chroma/Pinecone)
// Business Analytics
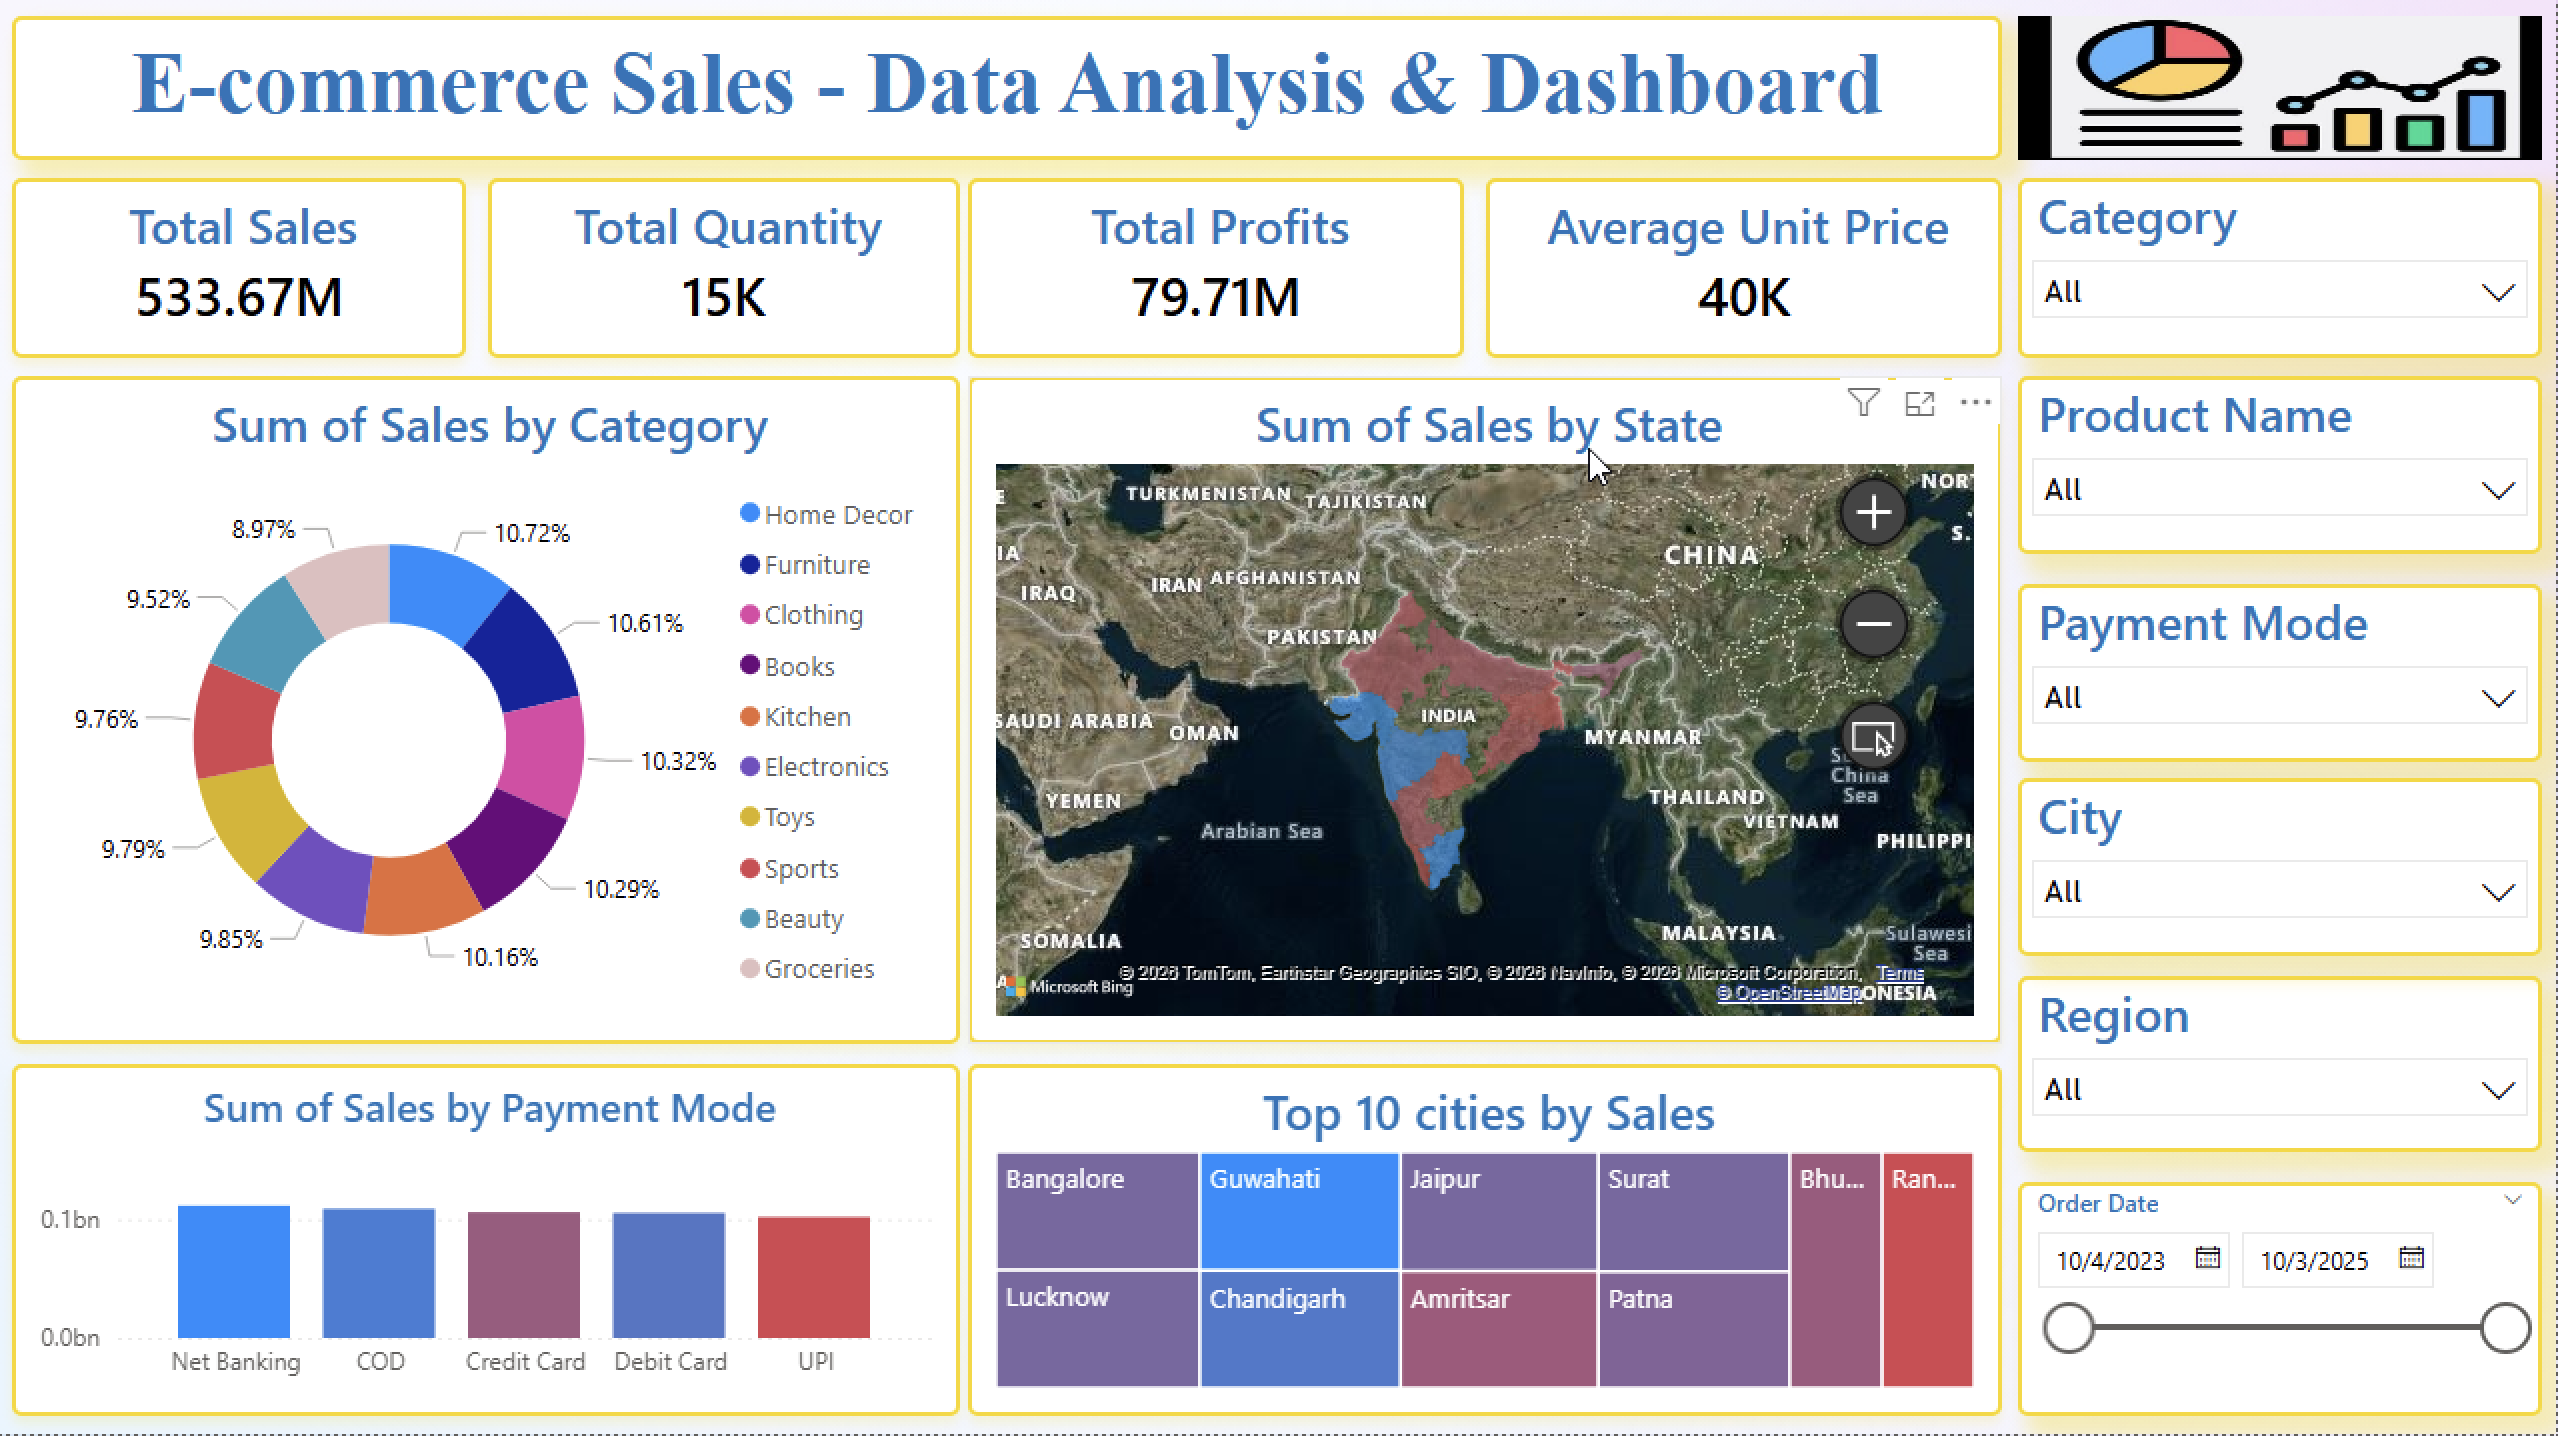
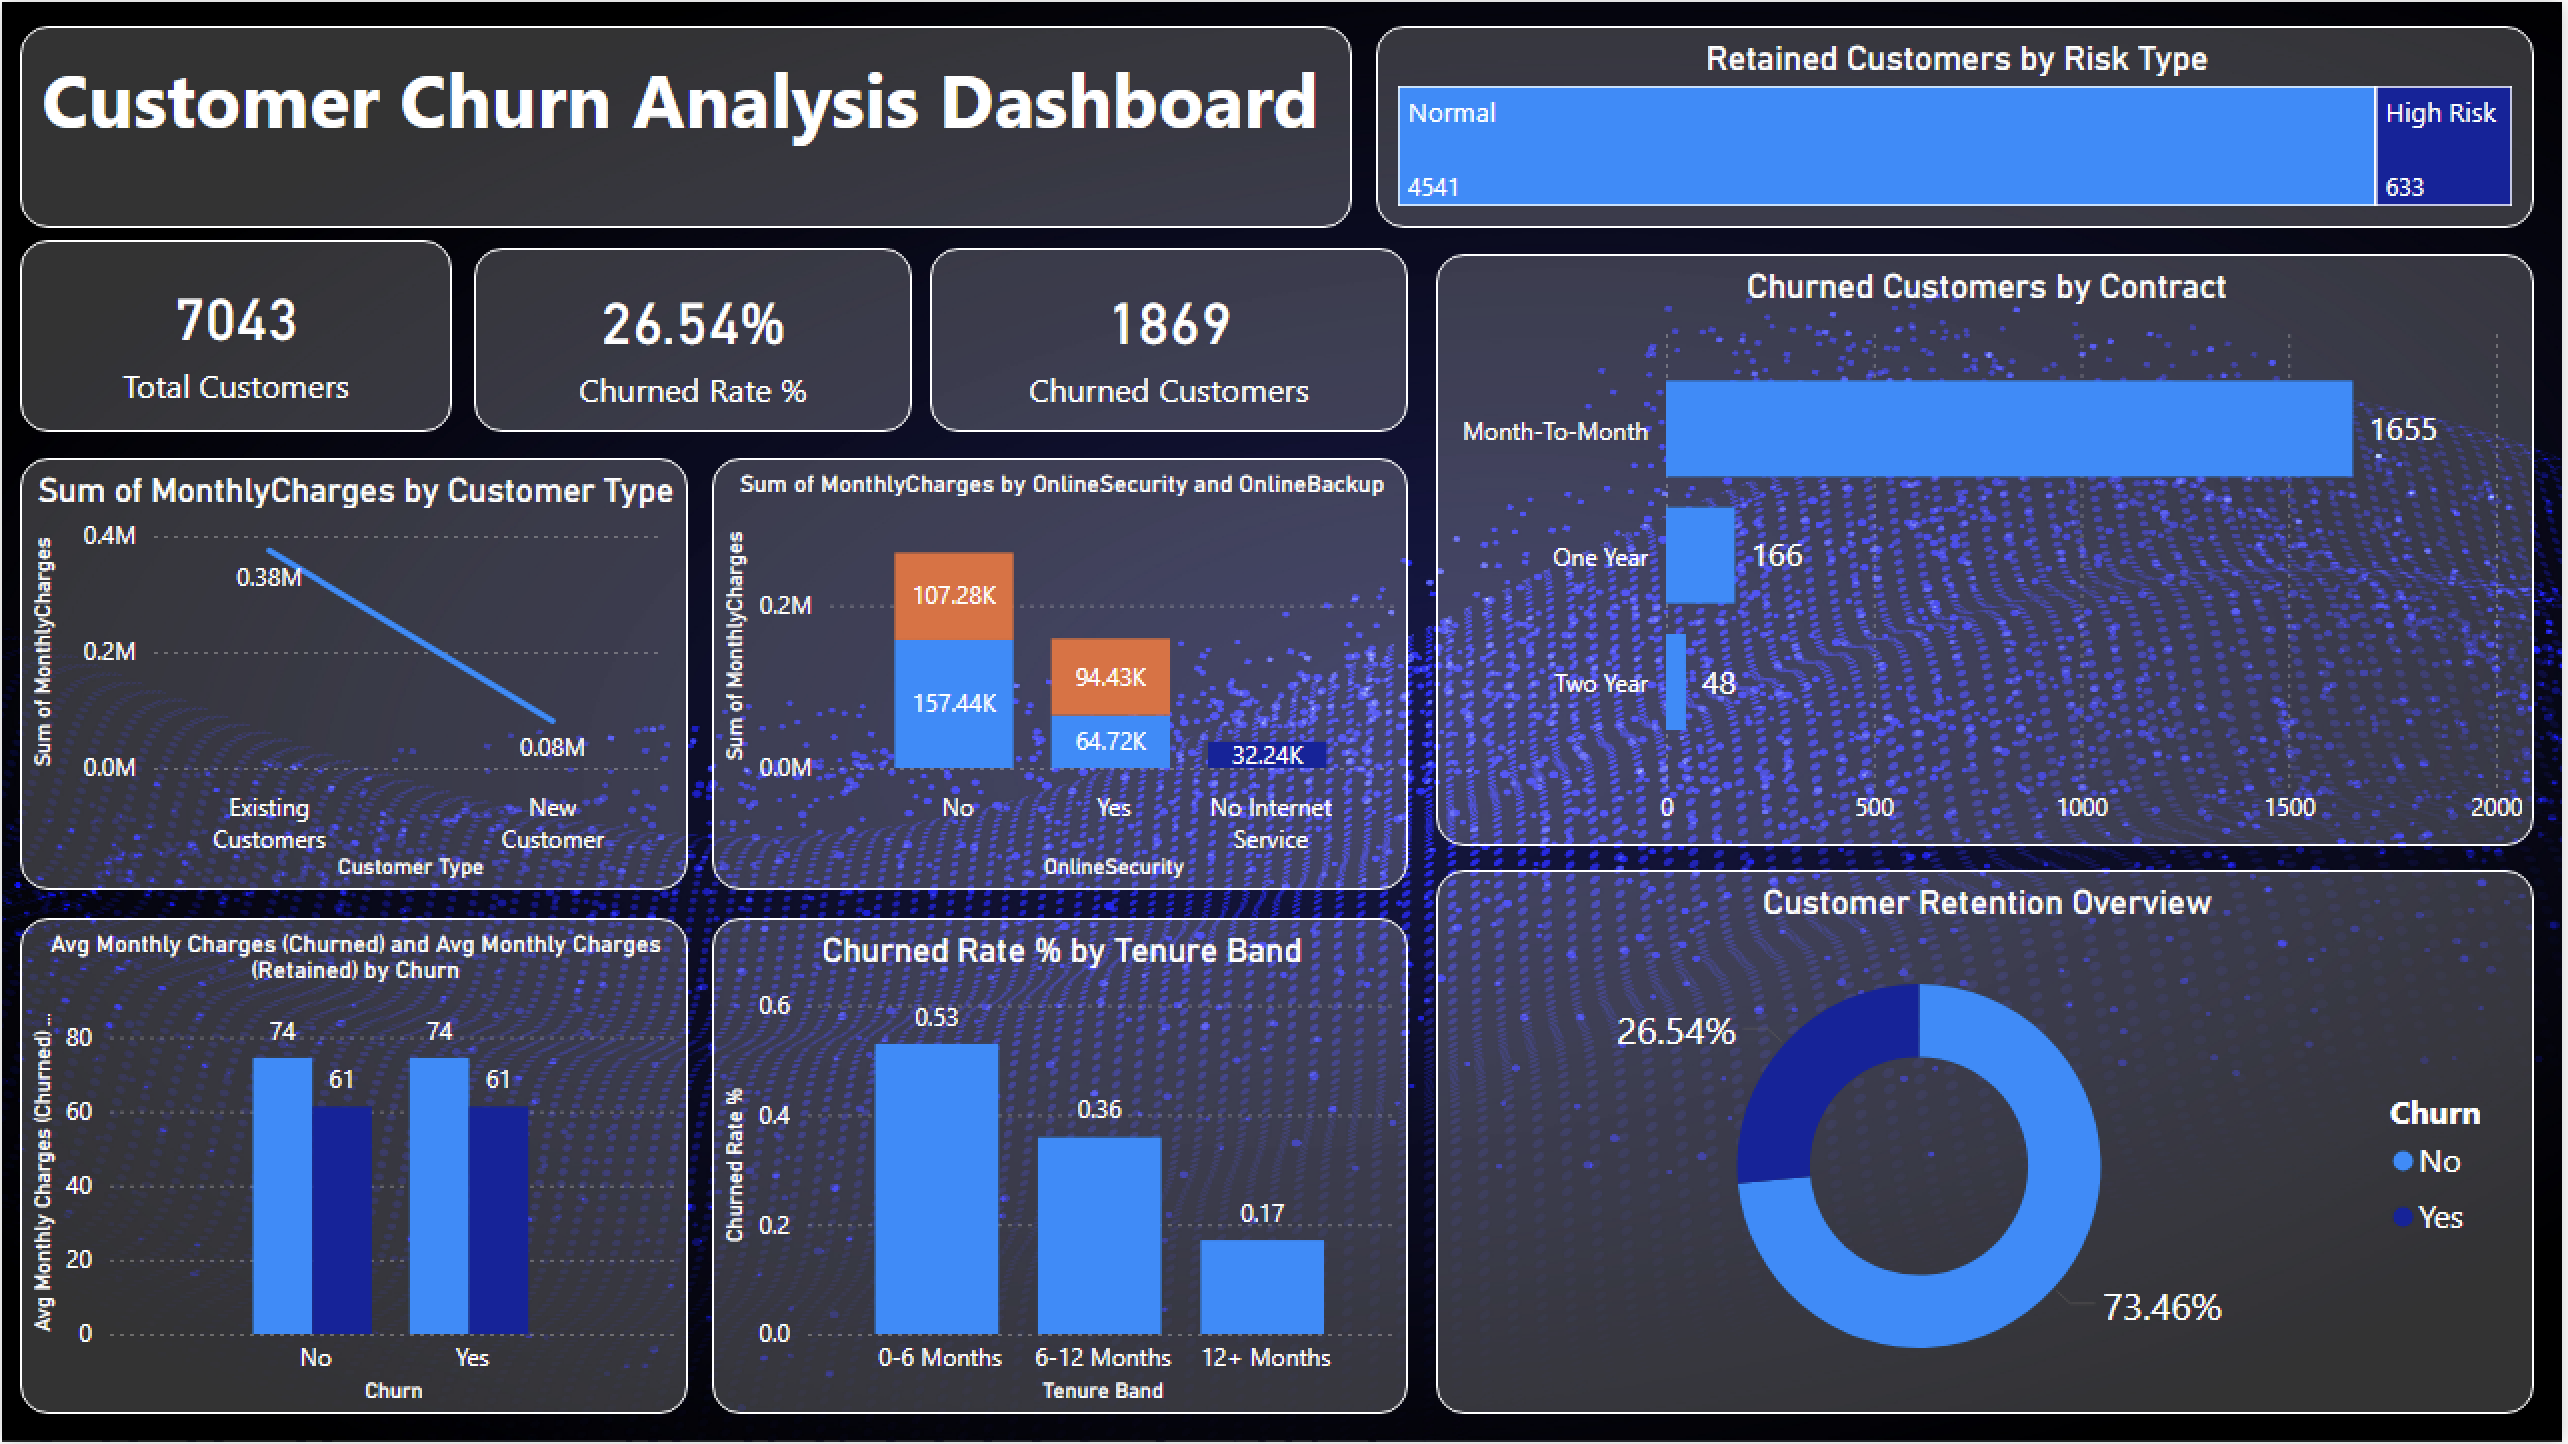
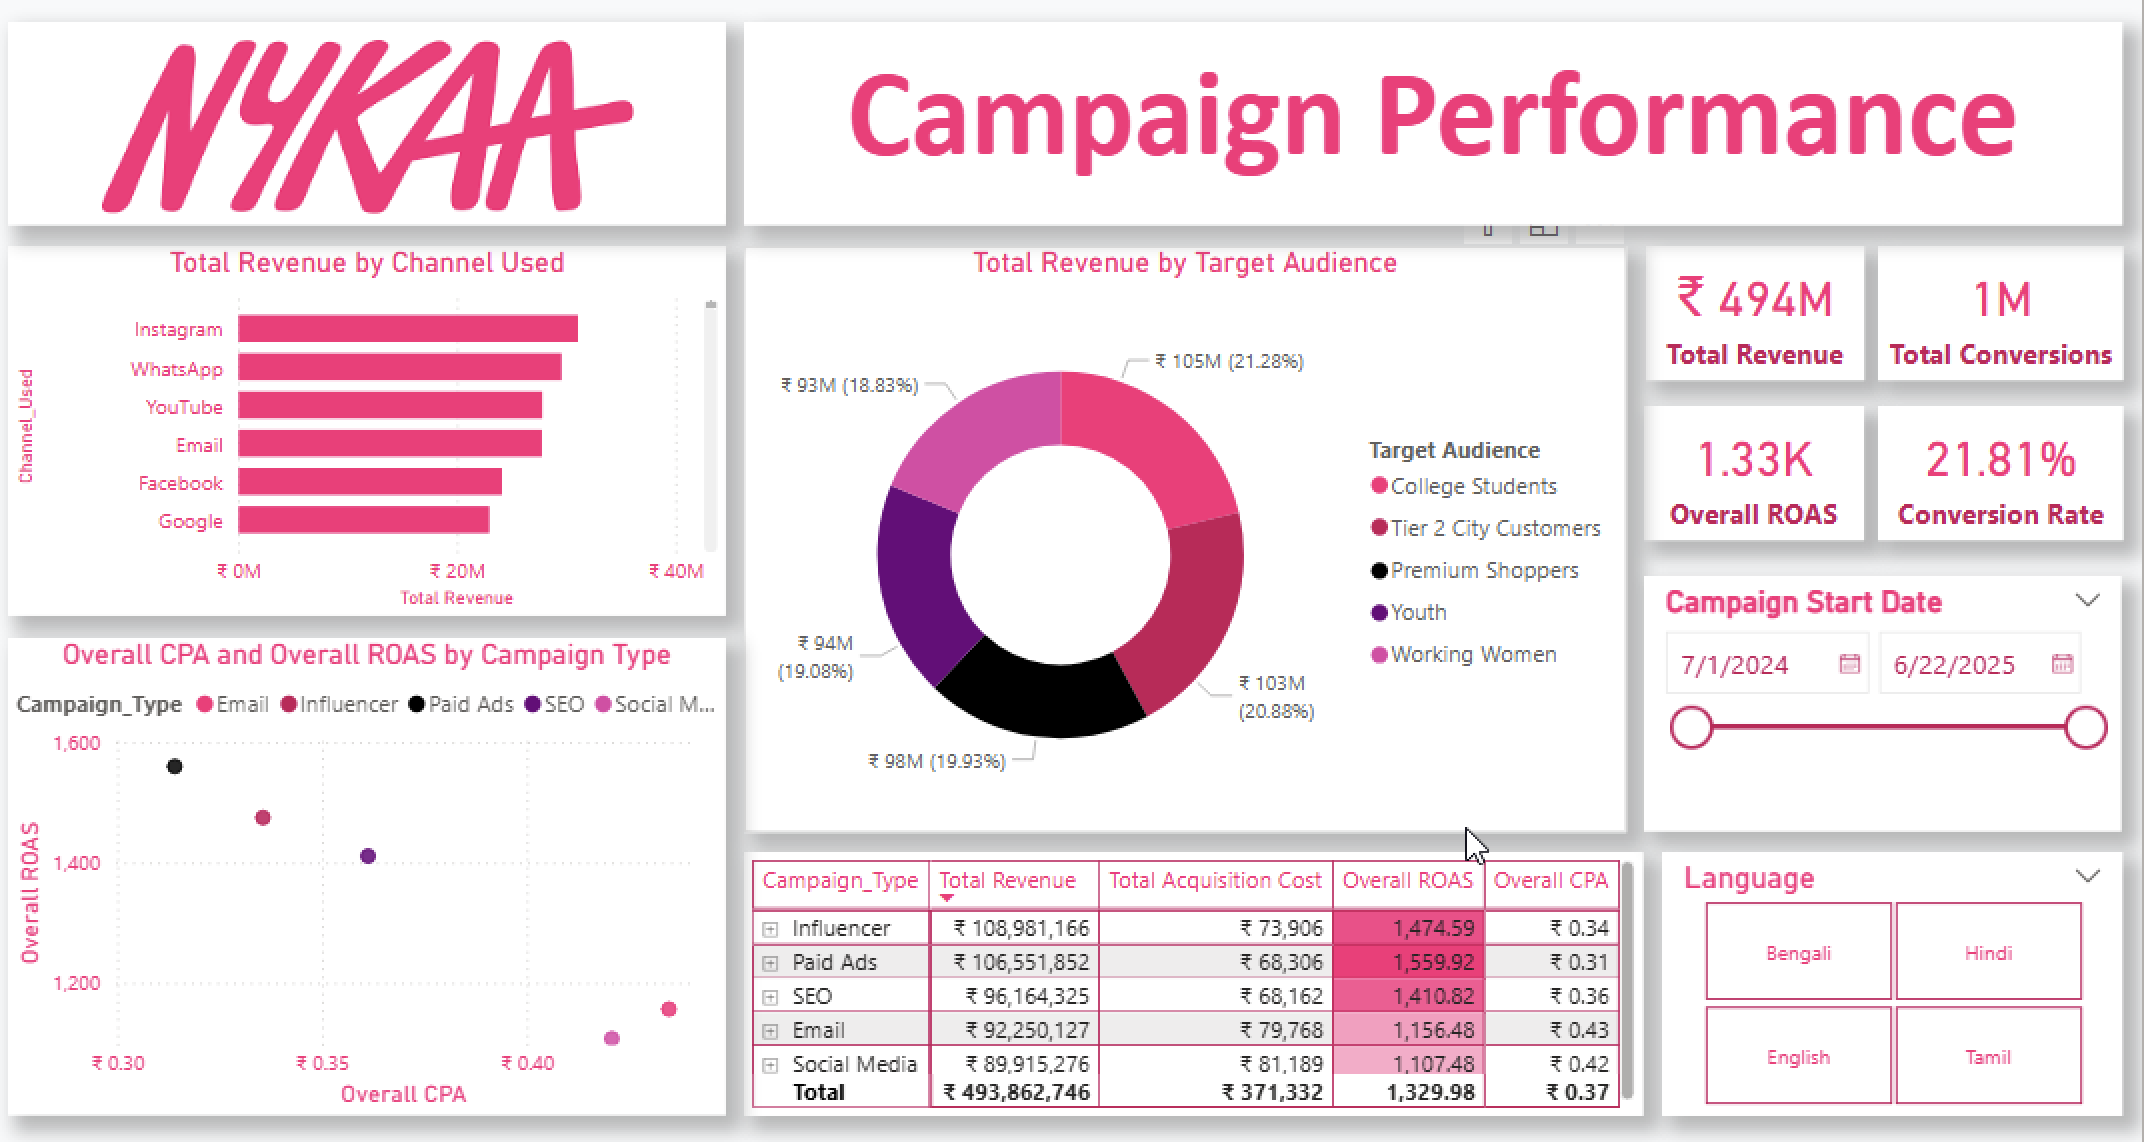
Power BI

Tableau

Analyst, Operations
2022-2023BluBrick Realty
- • Extracted, cleaned, and validated time-sensitive customer and property data from multiple sources
- • Built Excel and Power BI reporting workflows that improved reporting efficiency by 30%
- • Partnered with cross-functional teams to resolve data discrepancies and support KPI-driven decisions
Education
MSc Data Science & Business Analytics
2025
Bachelor of Commerce
2021